


 agniveer
REVENUE TREND ANALYSIS DOT
The components of Non-Tax Revenue Collection by Department of Telecommunication through Pr. CCAs and CCAs are as follows:
i. License Fee collection from Centralized Licenses
ii. Spectrum Usage Charge (SUC)collection from Centralized licenses
iii. License Fee collection from Decentralized Licenses
The Pr. CCA/ CCA wise Non-Tax Revenue collection for the FY 2022-23 as per intimated by CCAs according to E-Lekha figures is as follows:-
(Amount in Crores)
| Sl. No. | Name of the CCA | LF Collection Centralized | SUC collection centralized | LF Collection Decentralized |
| 1 | AP | 653.09 | 206.09 | 4.93 |
| 2 | Assam | 352.17 | 103.79 | 0.22 |
| 3 | Bihar | 624.66 | 178.64 | 0.65 |
| 4 | Chhattisgarh | 25.37 | 16.51 | 0.76 |
| 5 | Delhi | 3460.47 | 246.52 | 445.04 |
| 6 | Gujarat | 932.23 | 324.83 | 7.38 |
| 7 | Haryana | 97.00 | 324.83 | 1.00 |
| 8 | HP | 129.20 | 41.75 | 0.74 |
| 9 | J&K | 192.60 | 49.28 | 0.3753 |
| 10 | Jharkhand | 444.60 | 151.40 | 0.52 |
| 11 | Karnataka | 1060.65 | 435.07 | 16.48 |
| 12 | Kerala | 206.53 | 435.07 | 49.63 |
| 13 | Kolkata | 279.37 | 119.68 | 0.80 |
| 14 | MP | 986.14 | 303.67 | 1.82 |
| 15 | Maharashtra | 1359.72 | 479.17 | 56.98 |
| 16 | Mumbai | 548.83 | 190.68 | 132.75 |
| 17 | NE-I | 133.63 | 46.69 | 0.77 |
| 18 | NE-II | 80.82 | 18.50 | 0.80 |
| 19 | Odisha | 377.53 | 117.39 | 1.01 |
| 20 | Punjab | 501.67 | 166.86 | 1.11 |
| 21 | Rajasthan | 840.34 | 311.64 | 3.13 |
| 22 | Tamilnadu | 1297.29 | 426.84 | 94.38 |
| 23 | Telangana | 589.93 | 311.46 | 14.73 |
| 24 | UP(E) | 1139.01 | 334.89 | 0.67 |
| 25 | UP(W) | 376.60 | 160.08 | 1.78 |
| 26 | Uttarakhand | 364.27 | 77.72 | 2.26 |
| 27 | West Bengal | 773.60 | 244.02 | 1.17 |
| TOTAL | 18444.45 | 5247.03 | 841.89 |
*An amount of Rs 1245 crores have also been received in FY 2022-23, for those FYs which are included in SC Judgment
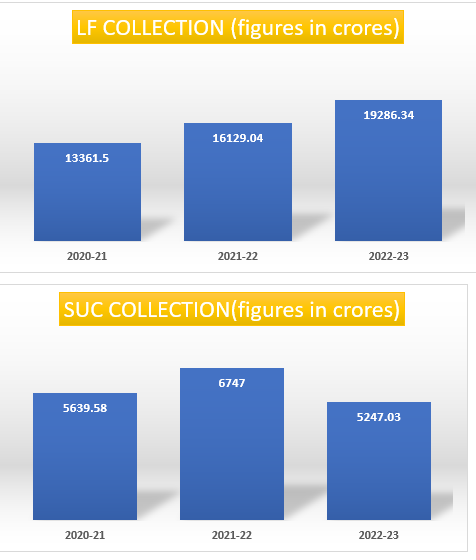
The FY wise trend w.r.t revenue collection is reflected in the graphs below: